

A new analysis by Hansen and colleagues concludes that both the impact of recent cuts in sun-blocking shipping pollution, which has raised temperatures, and the sensitivity of the climate to increasing fossil fuels emissions are greater than thought.
The group’s results are at the high end of estimates from mainstream climate science but cannot be ruled out, independent experts said. If correct, they mean even worse extreme weather will come sooner and there is a greater risk of passing global tipping points,
Everything’s on course for the collapse of civilisation under the weight of human stupidity :)
All of 2024: +1.6C
https://www.bbc.com/news/articles/cd7575x8yq5o
Jan 2025: +1.75C
We are currently either on track with or overshooting the literal worst case scenario from IPCC 6, in terms of actual temperature.
Taken from the longer report of IPCC 6.
Go to page 37 and start reading through the Impacts and Related Risks, knowing that the literal worst case scenario from 2 years ago is now basically our most likely scenario, and may actually be overly optimistic.
Wtf I thought the projections were like 2.5-3⁰C a while back
Those projections were never realistic. They were the optimistic “best case scenario” which the IPCC — a political org funded by fossil fuel dependent economies — touted as the “most likely” average, when it never held more than a 50/50 chance even if everything went to plan.
The whole 1.5 - 3c “likelihood” was dependent on major variables we don’t actually control (like how much carbon the remaining forests absorb), and confounding variables (like feedback loops and major weather systems reversing/collapsing) were downgraded or completely ignored due to a horrific level of uncertainty/unknowability. In statistics, if you don’t have real world data and can’t analyze a variable with any reasonable degree of confidence, you tend to omit it entirely.
Most of the actual climate scientists have been saying we’re on track for the worst case scenarios due to this and actual weather patterns (we’ve been hugging the upper limit of projected warming the entire time).
Man I remember when IPCC scientists quit in protest because the organization refused to let them publish a report containing the sentence “incremental changes will not be a viable solution to global warming” back in like 2016 or 2018. Fuck I can’t even find it on Google anymore, i swear this was real.
I remember it too. I feel like Winston in 1984. “Was the picture real or did I just imagine it …?”
Disclaimer: I am not a climate scientist, there appears to be one in this thread, maybe he could comment, that being said:
Yep.
You are correct, that was the consensus a few years back.
Then, things kept getting worse than what that consensus would suggest.
In 2020, +2 to +4.5 C by 2100 was generally the consensus.
Heres an article in Nature from 2022.
https://www.nature.com/articles/s41598-022-16264-6
For each CMIP, two climate scenarios were considered: a middle-of-the-road scenario with effective GHG emission reductions, and a business-as-usual scenario with virtually no GHG emissions reductions. These scenarios correspond to SRES B1 and SRES A2 for CMIP334, RCP4.5 and RCP8.5 for CMIP517, and SSP2-4.5 and SSP5-8.5 for CMIP618, respectively.
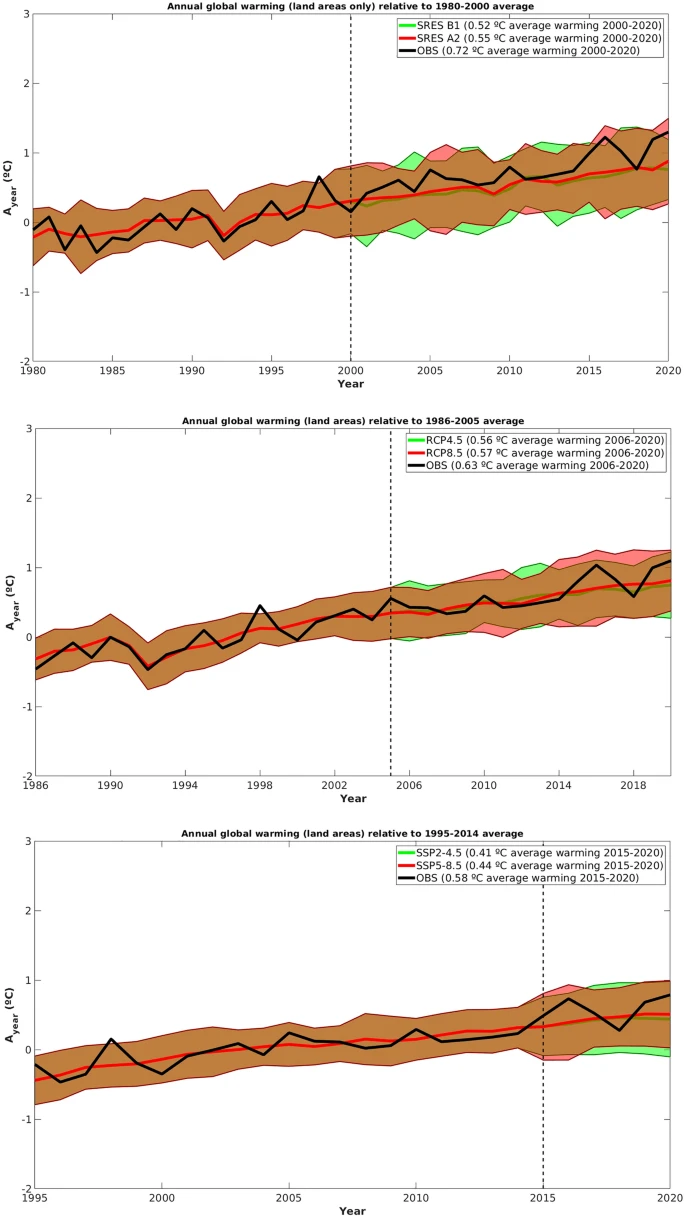
Figure 1 shows that, for all CMIPs and scenarios, the observed warming generally fits well within the projected warming range, and closely follows the CMIPs median warming lines. The observed warming is usually closer to the upper level of the projected warming ranges. Considering the average warming for the whole future period, CMIP3 SRES B1 (SRES A2) average warming is 0.20 °C (0.17 °C) lower than the observed one, while for CMIP5 RCP4.5 and RCP8.5 the average warming is 0.07 °C and 0.06 °C lower than the observed one, respectively. CMIP6 SSP2-4.5 and SSP5-8.5 average warming is 0.17 °C (0.14 °C) lower than the observed one.
Thus, all CMIPs temperature projections up to 2020 are slightly conservative, particularly CMIP3. However, it should be noted that CMIP6 future period comprises only 6 years, which is relatively short to draw solid conclusions.
Emphasis mine.
Here’s the older RCPs from the IPCC in 2013
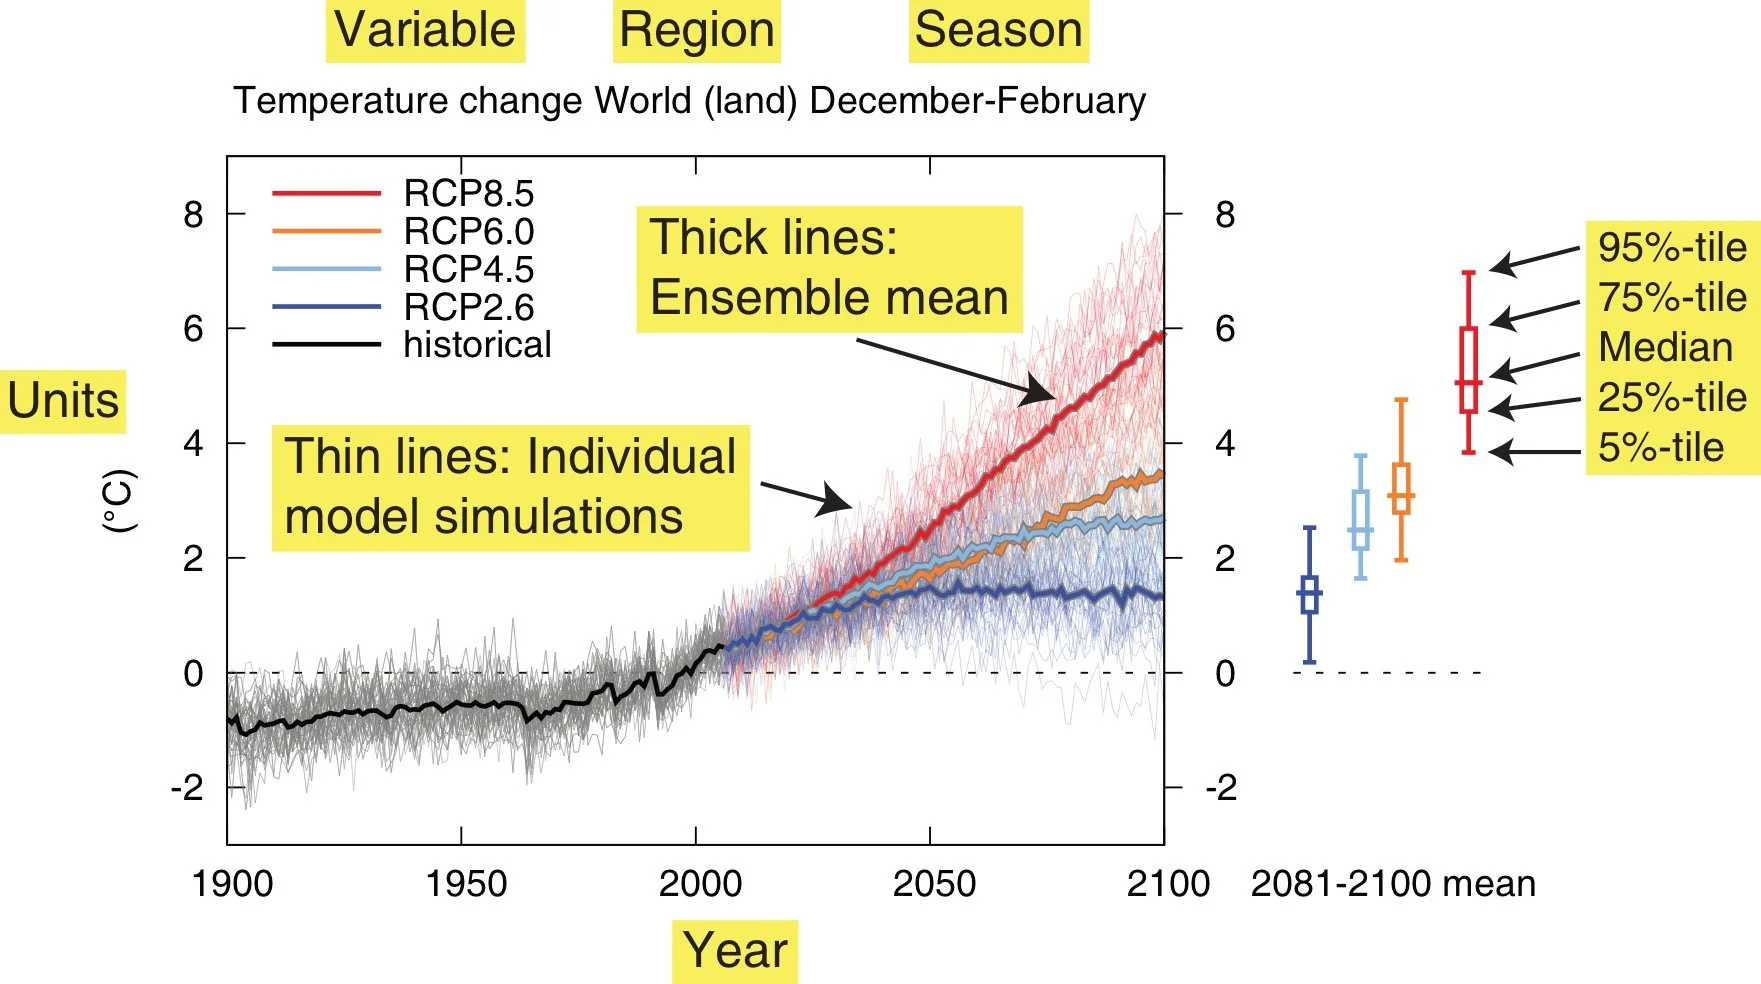
Unfortunately I am on a shit tier phone and cannot pull data and compose/plot my own graphs comparing actual data with model projections… but uh yeah, its looking to me that actual real world temperatures are at best following basically the worst case model scenarios in the last few years… and might even be breaking out, upwardly, of the 95% confidence channels for even those, if something like +1.75C this January is not just some weird fluke, and is indicative of the trend of all of 2025.
That would mean we’d hit +2.0C by or before 2030, the graph goes exponential, hockeysticks, much, much more soon than the current consenus projection models.
Again to repeat that disclaimer: I am not an expert, but I am extremely concerned. The way I see it, following climate science related news for about 2 decades now, it seems to me there is a fairly well established tendency for the consensus to actually be too optimistic. Almost everyone keeps being surprised, almost year after year, by actual data, actual events being worse than consensus projections.
I almost died in the heat dome in the PNW a few years back. Am poor. Do not have AC. Have health conditions.
Spent 3 straight days, inside, with blackout curtains and reflective solar blankets up on the windows… it was over 90F-95F at night, up to 105-110F during the day.
I lost 10 pounds from sweating in 3 days.
Nothing like that had ever happenes before in recorded PNW history, and the knee jerk response at the time from almost every climate scientist that commented on it was ‘well actually thats just a weird freak one time thing and we can’t actually attribute it to global warming’ … and since then just all over the US, insane climate events keep happening regularly that 20 years ago would have been ‘once in a life time.’
My strong, unprofessional suspicion is that we are literally cooked.
That sounds terrible. Thanks for providing the historical perspective.
Didn’t even register your username.
Go look up how the arctic permafrost is rapidly melting, releasing ungodly amounts of methane, which is roughly 70x more potent a greenhouse gas than co2.
A couple years ago now I first saw that rivers in Alaska were being reported as running a kind of bronze/orange color… go look up ghost/zombie forest fires, where forests in siberia, alaska and canada are burning down from the inside out, from underground methane that catches on fire.
I love all the stuff you have posted, I just have one small correction, methane has about a 30x stronger GHG effect than CO2. I also believe we are fully cooked for all the reasons you laid out. It’s honestly keeping me quiet a bit more calm during the current shit show in the USA.
Even in the worst possible case scenario with that, they will get 10-20 years of ruling at best before they are undone by their own hubris. I really think that in the next decades hurricanes are going to go ape shit and one will actually LEVEL Miami. I mean shit, with sea water rising and flooding skyscraper basements, eating away at concrete and steel, a strong enough hurricane could topple one right over.
I saw 72x in the last article I read mentioning it, can’t find it, MIT says 84x CO2 for the first 20 years.
In the first 20 years after it enters our atmosphere, methane will trap around 84 times more heat, pound for pound, than carbon dioxide (CO2), the best-known greenhouse gas.
https://climate.mit.edu/ask-mit/how-much-methane-do-human-activities-put-atmosphere
The point is that its kind of like a bullet:
CO2 heats up the atmosphere up to a point, thats like a hammer being cocked back slowly while your finger is on the trigger.
Atmosphere hits a certain tipping point, apparently it was about +1.5C, at that point the hammer swings and hits the primer, primer then ignites the much, much more powerful gunpowder.
Gunpowder going off is what actually fires the bullet, sends temps and other feedback loops into overdrive very fast.
Gun is pointed at our head.
But anyway, damn the details, we do appear to be well and truly fucked.
I keep laughing any time any news commentator says ‘history will look back at X and think…’
There’s not gonna fucking be any history, any historians, 100 years from now, at the rate we are going.
I literally looked it up before I corrected you but who fucking knows honestly. Maybe I did a piss poor job. Bottom line is, we fucked, bigly.
I think the exact thing with all the news. In some morbid sense, those being killed now and in the near future are just skipping the line and avoiding the rush. They don’t have to see how truly UGLY it will get towards the end.
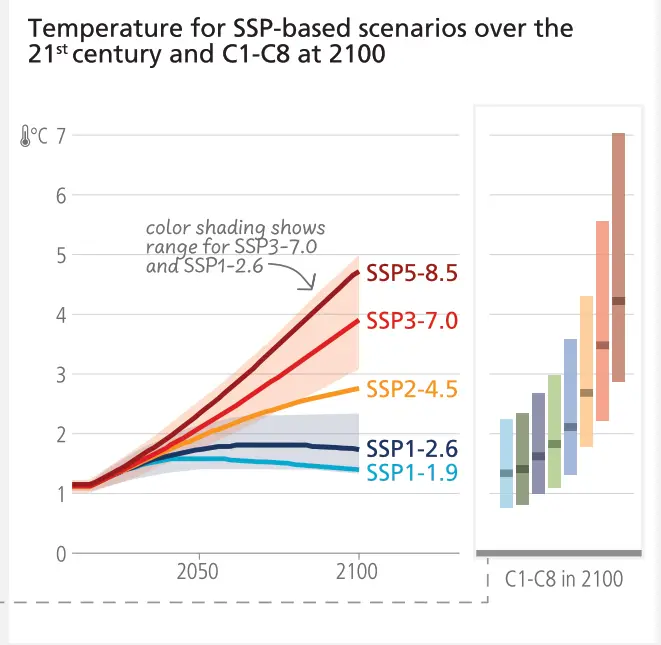
I’m not convinced this plot bears much relation to the Hansen et al paper. The plot combines SSPs - socioeconomic scenarios, RCPs - levels of ‘radiative forcing’ (all gases together - the numbers 1.9 to 8.5 are RF in W/m2) and temperature.
Hansen et al (OP) are suggesting that the climate sensitivity may be higher than the IPCC range, which would imply a higher temperature for any given RCP level. This suggestion is derived from the recent history of aerosols and temperature, as I discuss in another comment (above/below?).
However this doesn’t change which curve we are on (in reality none of them), as the big difference between curves is from projections of future emissions depending on technology, population, policies etc. Also the near-term projections have little relation to the long term, due to inertia but also the range of different models and assumptions used to make them (some years ago). So you can’t look at very recent data to derive which curve we are on.I was (years ago) part of the process that designed the IPCC scenario structure of splitting the SSPs from RCPs, to allow the two modelling groups to work in parallel rather than one waiting for the other, so they could get on with connecting feedbacks (not sure this happened…).
But IPCC ends up re-blending too many varying factors in one plot, because they have page limits, which can be somewhat confusing. Work of 10,000 scientists over six years condensed into one summary report… - is that the most effective method of communication ? That’s why I prefer to make an interactive model.Fundamentally, the useful question is not ‘where are we going’ but ‘where do we want to go’ - taking into account all the feedbacks and inertia in the systems, but making choices about our common future. To get to the lowest (1.9) curve we’d need a global green revolution tomorrow, but it’s not physically impossible. As for the 8.5 curve it’s very unlikely it’s part of the set as similar to earlier high-end scenarios run by IPCC since 1990s, which might have happened if we’d stayed in the coal age (still useful for comparing the high end of the physical models). The others are still in play. Extrapolating current trends and policies (especially tech and popn in China) I’d say the most likely is somewhere between 2.6 and 4.5 curves, but we could do better. While if you are building sea-walls you should anticipate worse. But don’t be fatalistic, we still have many options.
[ Side remark in response to comment - as for Jan 2025, it’s really not ‘climate’ to conclude anything from one month. Even the El-Niño cycle depends on heat transfer between surface and deep ocean, which is a slow process, you need to integrate over much longer time. There may be a warm anomaly recently in tropical oceans, and also the high-arctic, but it’s actually quite cold where most northern people live (due to Rossby waves whose amplitude is increasing, as we expected in an hand-waving kind of way). ]
I’m not convinced this plot bears much relation to the Hansen et al paper. The plot combines SSPs - socioeconomic scenarios, RCPs - levels of ‘radiative forcing’ (all gases together - the numbers 1.9 to 8.5 are RF in W/m2) and temperature. Hansen et al (OP) are suggesting that the climate sensitivity may be higher than the IPCC range, which would imply a higher temperature for any given RCP level.
You are of course much more technically correct in pointing out that if Hansen et al are correct, what that means is functionally all RCPs, as plotted in the graph I picked from the IPCC report, basically shift upward, or climb faster.
But I do not have the ability to run all the models and plot my own graphs and label them properly, I just have a shitty phone.
I also had a career in general data analytics, and sometimes, quite often actually, nobody understands what your data visualizations mean if they are too complicated and can’t be explained with a fairly simplistic narrative.
So basically, the ‘revised’ RCP 2.5 - 4.5 line, just shifts to roughly where the ‘unrevised’ RCP 5 - 8.5 line is now, if Hansen et al are correct.
In terms of visually displaying the concept that ‘we are actually overly optimistic in our future temperature projections’, I feel that what my original post said and displayed is basically accurate and conveys this to a lay reader, again, best I can do on a phone.
As far as the actual empirical/theoretical validity of this view?
Well here’s Paul Beckwith going through Hansen et al’s recent paper.
www.youtube.com/watch?v=ZplU7bJebRQ
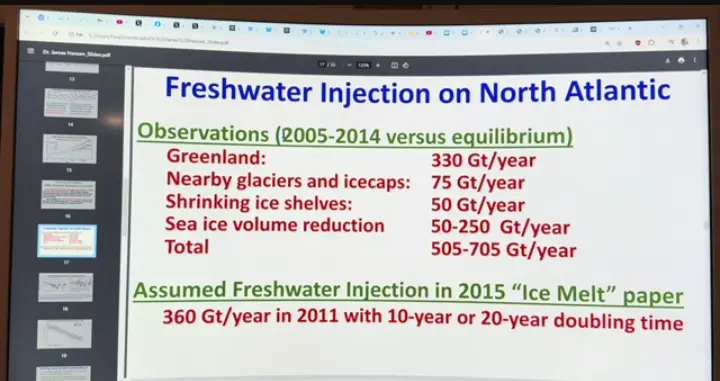
The jist of the argument seems to be twofold, first, that removing sulfur from the fuel of transoceanic shipping vessels has lowered the amount of negative or downward atmospheric forcing.
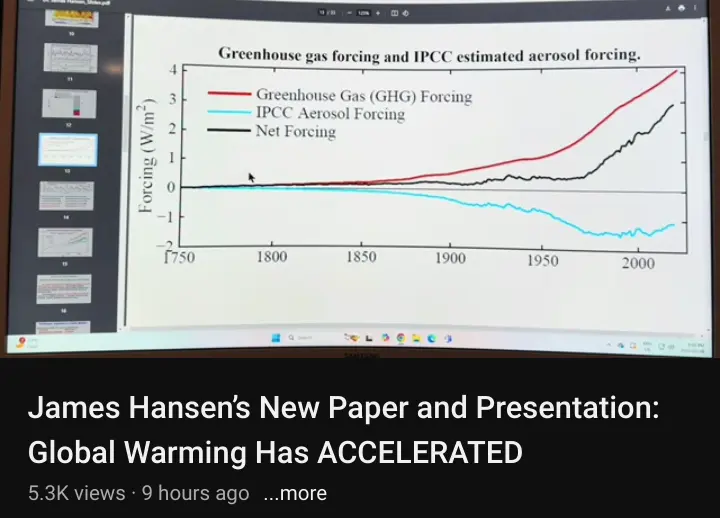
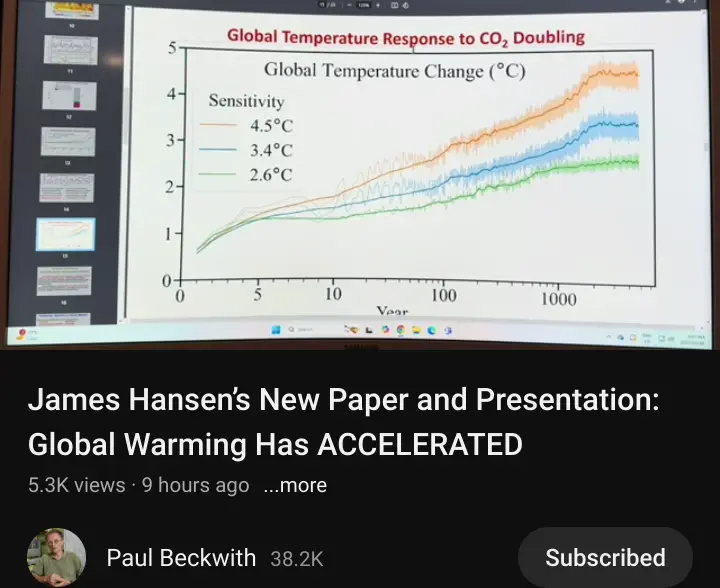
Beckwith says the IPCC has a climate sensitivity for a doubling of CO2 is about 3C, Hansen says its about 4.5C.
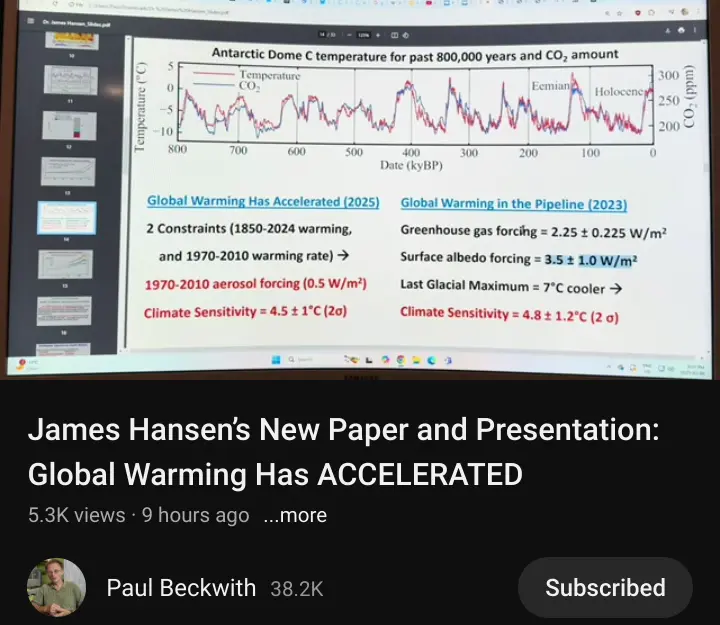
Further, the second major point is that IPCC seems to have rejected Hansen’s older, higher estimates of the effects of arctic freshwater ice melt forcing in their models…
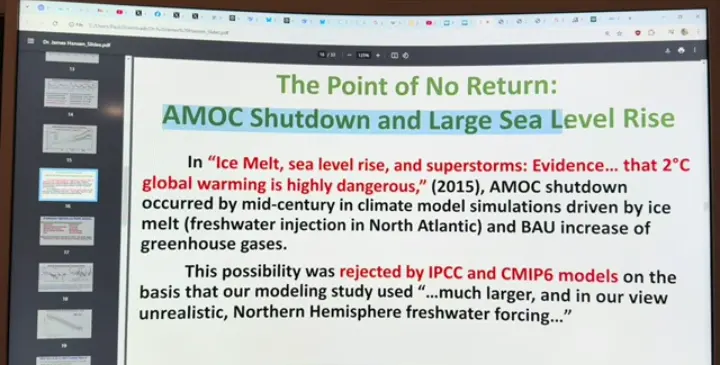
… but, actual, observed arctic ice melt seems to be double what even Hansen’s older paper estimated, meaning the IPCC models are very significantly underestimating that.
As to you saying that the El Nino temp from one month isn’t a good point to use to indicate overall climate… yes, but the El Nino temp is significantly higher than what we should expect from the existing Nino3.4 model, it appears to have broken away, upwardly, from the model.
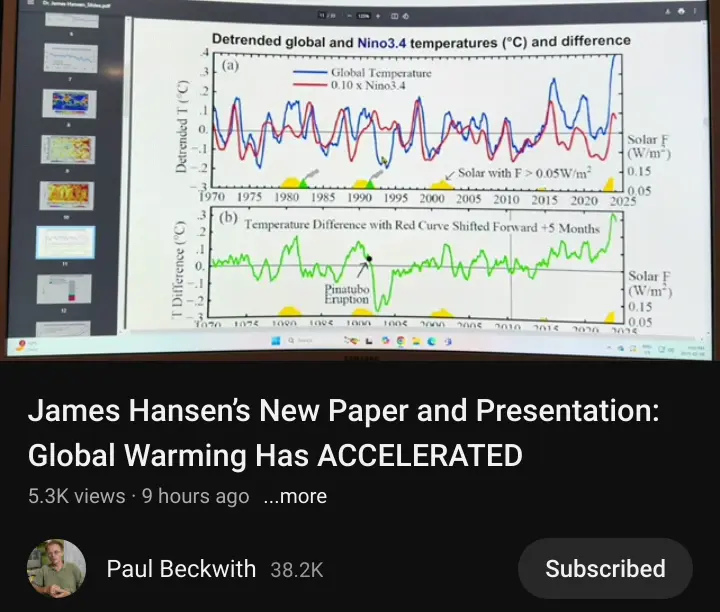
I should have been more clear about that, my point is that it is so significantly higher than what we expect, that it is yet another indicator that existing models are too optimistic, too constrained in terms of overall temp outlook.
…
Beckwith, himself, in this video, says he would expect us to hit +2C within a decade or less.
I think the Guardian article may be somewhat exaggerating what the Hansen et al paper says. I’ve been studying this kind of problem for 30 years. It’s indeed true, that there are many ways to explain the historical temperature rise, by adjusting the balance of positive (mainly greenhouse gases) and negative (sulphate and white-carbon aerosols, volcanos etc.) forcings. So if you think the aerosol effect was greater, you also have to assume the greenhouse warming was greater to balance - hence deriving a higher climate sensitivity (CS). In this case, they are arguing that we underestimated the (former) cooling effect of shipping sulphate - I’d agree this is not a trivial factor (and similarly for the warming effect of aviation induced cirrus, which we could also change quickly with global transport policy). However, I really doubt this change is sufficient to justify such a big shift from the long-developed consensus range of CS.
In general, the recent historical data series has never been a sufficient constraint on CS (I know from having tried a similar approach for probabilistic analysis with earlier versions of my own model). So we have to use other methods too, and the IPCC consensus for the likely range of 2.5-4ºC for CS is derived from a wide range of methods and sources, particularly but not only big physics-based models (GCMs). I’d be very cautious about overturning this based on any one study, despite my respect for Hansen and colleagues. Of course, this contributes an interesting new view on this important topic, but it does not justify the headline of the article.Honest questions:
Does your model take into account that the ‘methane clathrate gun’ seems to have been fired?
That more and more of the arctic is rapidly converting from a carbon sink into a carbon source?
https://news.mongabay.com/2024/05/polar-warning-warming-temperatures-mean-more-than-melted-ice/
My model, no not yet clathrates or specific permafrost feedback, although I’m concerned about these and would like to put such feedbacks in (with wide adjustable parameter ranges to reflect high uncertainty). My model is interactive, you can play with it in a browser, so it’s hardly typical.
However, in relation to the OP and the Hansen paper, it’s important to understand that the usual definition of climate sensitivity does not include such “slow” feedbacks - it’s assumed to assume fast atmospheric feedbacks e.g. physics of clouds, but not slower biogeochemistry. CS has been used for decades for comparing models, so it’s useful that the definition remains the same, simply the equilibrium (multi-century) response to CO2 doubling, it’s not any kind of prediction. That’s why it’s surprising that he would draw strong conclusions from a number (4.5) that’s well beyond the normal range.
Complex 3d physics models derive CS, while integrated assessment models use CS as a calibration parameter for one component of a complex system, including socioeconomic drivers, emissions policies, land use change, etc. Most models (including mine) do have some climate - biogeochemistry feedbacks (for example, there is faster soil respiration at higher temperature), which are included in such ‘real’ scenario projections, but wouldn’t change the CS.it’d be interesting to see (without knowing whether this is actually already the case with most of the models scientists use) a model that looks at the predictions we’ve made, discoveries that have led to changes, and factored in the likely changes to come in the future… it seems our refinement of these models has often been “oops we didn’t think about this source” and it happens pretty regularly
The word of one scientist does not consensus make. No matter how renowned. Remember, making targets seem impossible is a tactic to keep going as we are since there’s “no point in even trying”.