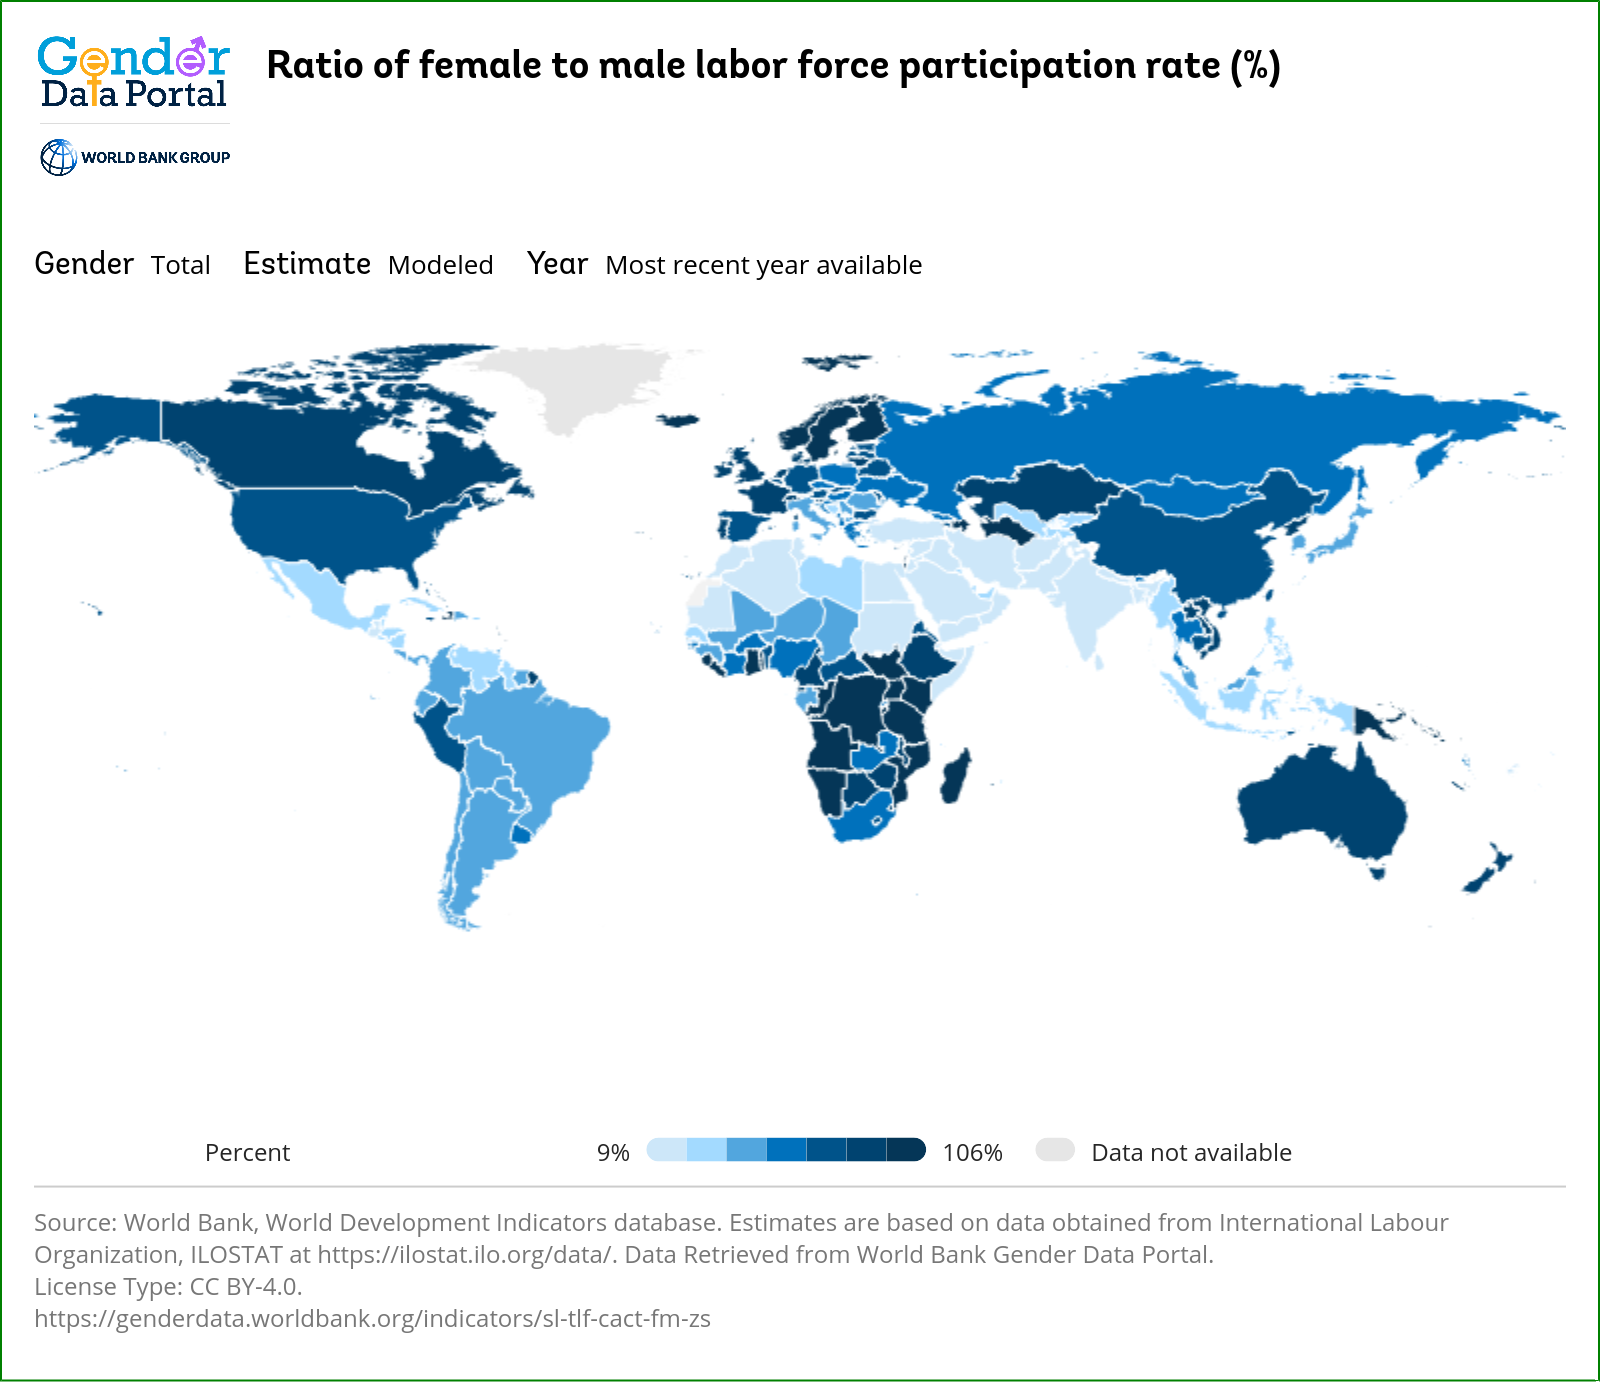
For scaling they just took the lowest participation to largest. Straight off the data with no adjusting for readability. And they divided it into seven brackets. Why seven? Whyyyyy??? It is like someone just took some data and ran it through their visualizer just to get something to their editor.


For scaling they just took the lowest participation to largest. Straight off the data with no adjusting for readability. And they divided it into seven brackets. Why seven? Whyyyyy??? It is like someone just took some data and ran it through their visualizer just to get something to their editor.