if we divide each of those percentages by 50, we should come up with the odds of dying in a given vehicle per year,
I’m being very nitpicky but this isn’t quite how it works, if you have a 90% chance of survival one year, you’d have 0.9^2 = 0.81= 81% chance of surviving two years in a row. With that in mind, the odds of dying should be relative to the fiftieth root of surviving fifty years, which gives:
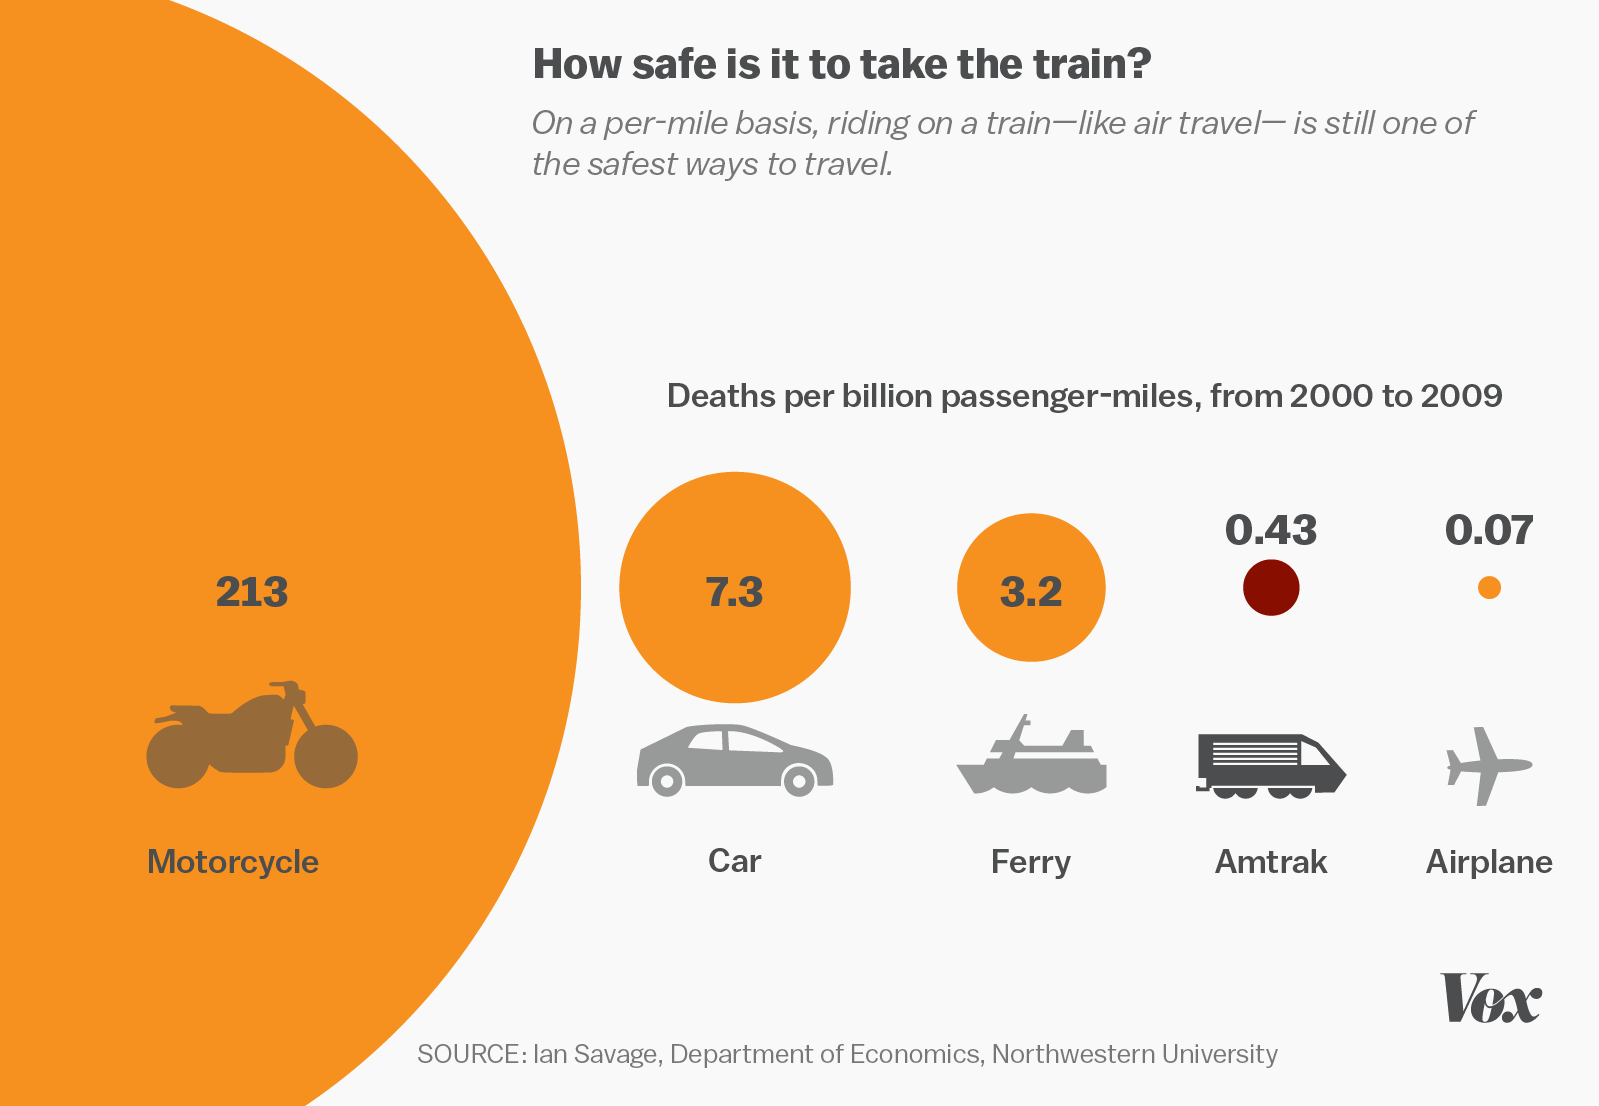
Motorcycle: 0.478%
Car: 0.151%
Ferry: 0.065%
Amtrak: 0.0086%
Airplane: 0.0014%
Without additional decimals it’s hard to see the change for the really small numbers but it doesn’t make much of a difference in reality.
I have no idea about the statistics about motorcycle fatalities and for personal reasons I’d prefer not to get into them. I was just commenting on the way the statistics were calculated year-by-year with the assumption that the original statistics for fifty years were accurate. That being said, it’s possible that those statistics were not completely correctly calculated as well.
The fifty year statistics were also computed wrong, for the same reason you already explained. It doesn’t make much of a difference since the probabilities are so small anyway.

I’m being very nitpicky but this isn’t quite how it works, if you have a 90% chance of survival one year, you’d have 0.9^2 = 0.81= 81% chance of surviving two years in a row. With that in mind, the odds of dying should be relative to the fiftieth root of surviving fifty years, which gives:
Without additional decimals it’s hard to see the change for the really small numbers but it doesn’t make much of a difference in reality.
Thank you, 1/5 of lifetime motorcyclists dying in wreck doesn’t add up.
I have no idea about the statistics about motorcycle fatalities and for personal reasons I’d prefer not to get into them. I was just commenting on the way the statistics were calculated year-by-year with the assumption that the original statistics for fifty years were accurate. That being said, it’s possible that those statistics were not completely correctly calculated as well.
The fifty year statistics were also computed wrong, for the same reason you already explained. It doesn’t make much of a difference since the probabilities are so small anyway.