- cross-posted to:
- hackernews@derp.foo
- cross-posted to:
- hackernews@derp.foo
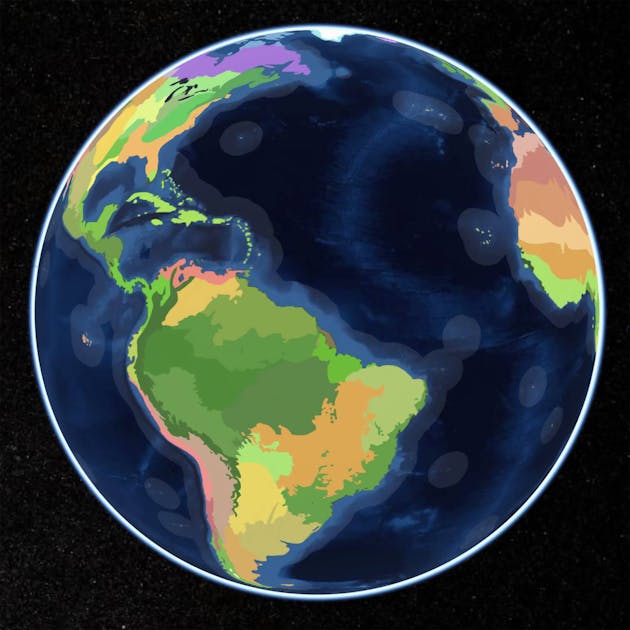
Nice maps and interactive tool. However it seems to me, this definition doesn’t sufficiently account for mountains, which have quite different ecosystems from their neighbouring plains. Also, will you recalculate this to show how these regions move over time, with climate change ?
Not mine, but there was a project already doing something similar. https://pastglobalchanges.org/science/wg/former/landcover6k/ there’s likely newer groups on there doing stuff too.
Thanks for link (end with /intro to make it work). I’m contemplating such maps for the purpose of defining a ±1000 region set for an interactive integrated assessment type model running timescale ±1750-2250 - so it needs to span multiple dimensions - political, demographic, climatic, landuse/ecosystems, for multiple end-purposes - for example exploring climate -migration - socio feedbacks, including being able to represent both historical and future changes, (although not such long timescale as PAGES).
That’s an end goal of many organisations like PAGES, I believe. We’re still trying to figure out those bits. Trends are going that way. We have data, the problem is now, how do we link it all.
https://www.google.co.uk/books/edition/Thinking_Big_Data_in_Geography/gIlQDwAAQBAJ?hl=en


