

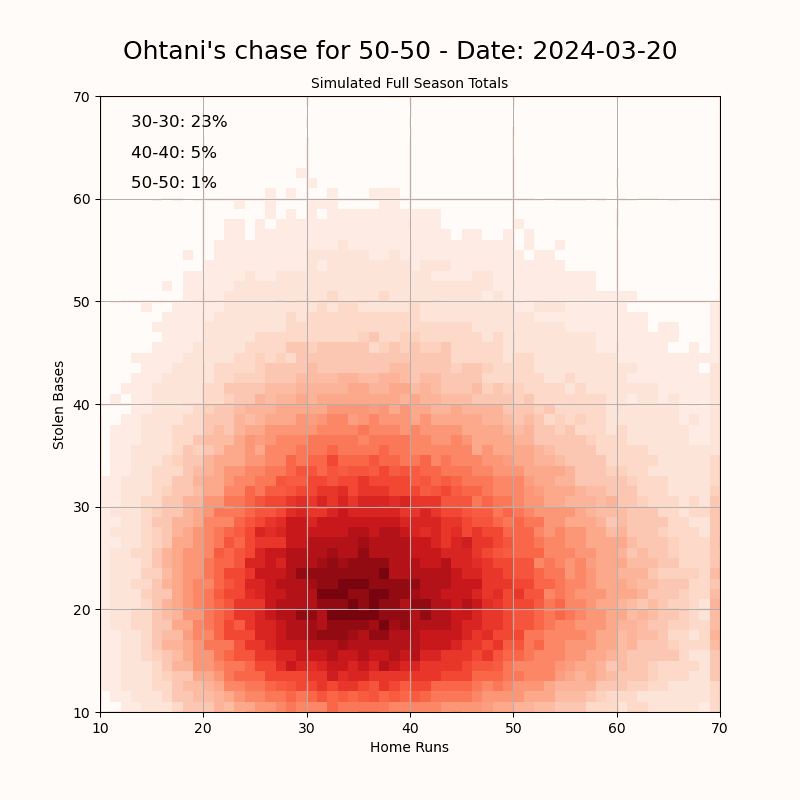
"I created this visualization to track Shohei Ohtani’s pursuit of a 50-50 season—achieving 50 home runs and 50 stolen bases in a single MLB season. Using data from ESPN, I simulated the remainder of his season to estimate the probabilities of reaching the “clubs”: 30-30, 40-40, and 50-50.
The 50-50 club refers to a player hitting 50 home runs and stealing 50 bases in a single season, which has never been accomplished in MLB history. It requires a rare combination of power and speed: the 40-40 club (40 HR, 40 SB) had been joined by only five players before this year.
I built a simulation model to project Ohtani’s performance over the remaining games of the season. The model uses his current stats as a baseline and generates a range of possible outcomes based on typical variability in player performance. To stabilize the projection at the beginning of the season, I used a Bayesian prior based on his historical stats. As the season goes on, the prior is given less weight so that the current season’s rates start to take over.
Data Source: ESPN
Tools Used: Pandas, NumPy, Matplotlib"
Thanks! I know jack shit about this sport but find the simulation interesting.
Two things especially:
- the probability jump when each day is calculated (going actually backwards) and
- a 100% outcome prediction even for the 40/40 reached basically in the last two days.
These two in combination make me think that the model seems to be set for an optimistic pattern, is that a reasonable deduction?